Have you ever finished mastering a song and felt like something’s still off? Even though it sounded fine in your studio? That’s where visual mastering techniques come in. Today’s mastering isn’t just about using your ears. It’s also about seeing your sound.
With the help of visual tools like LUFS meters, stereo imaging scopes, and spectrum analysers, you can understand your music on a deeper level. These tools help you make smarter, faster decisions with more confidence.
In this blog, we’ll explore how to master a song using your eyes as well as your ears. From EQ balance to dynamic range, we’ll break down the visual side of mastering music, step by step.
Table of Contents
- Why Visual Tools Matter in Mastering
- LUFS and Loudness Meters
- Spectrum Analysers
- Stereo Imaging Scopes
- Phase correlation Meters
- Dynamic Range and Gain Reduction in Mastering Techniques
- Visual Workflow Walkthrough
Why Visual Tools Matter in Mastering
When it comes to mastering techniques, our ears are powerful, but they can also play tricks on us. Room acoustics, tired ears, and playback systems can affect how we hear things. That’s why visual tools are such a game-changer. They help you see what your ears might miss.
Visual mastering techniques give you real-time feedback. You can spot frequency build-up, check stereo imaging, and track loudness with precision. This helps you avoid common mistakes, like over-compression or harsh EQ boosts.
Think of it like driving with a dashboard. Sure, you can feel the speed, but it’s safer when you can also see the numbers. Mastering a song works the same way. With meters and graphs, you get a complete view of your audio processing decisions.
Whether you’re just learning how to master a song or you’re deep into EDM mastering or digital mastering, these visual tools give you an edge. They improve your workflow, save time, and help your tracks sound great—on every platform, every time.
LUFS and Loudness Meters
One of the most important mastering techniques today is understanding loudness, not just by feel, but by measurement. That’s where LUFS meters come in. LUFS stands for Loudness Units Full Scale, and it helps you control how loud your master sounds across different platforms.
What Is LUFS and Why Does It Matter
Different platforms like Spotify, Apple Music, and YouTube normalize volume. This means if your track is too loud, the platform will turn it down. If it’s too quiet, it might get lost next to other songs. LUFS gives you a standard to aim for so your music sounds balanced everywhere.
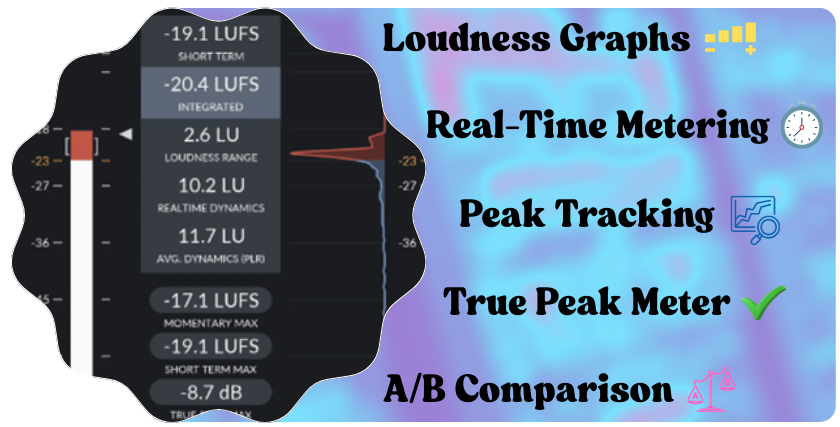
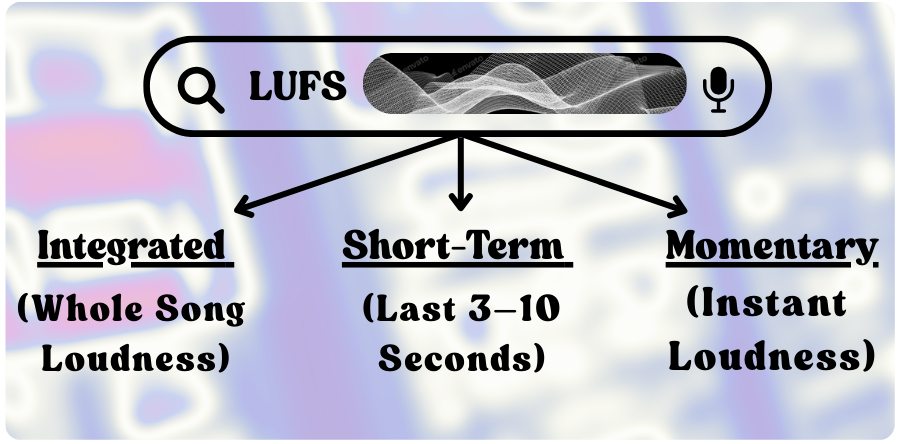
There are three main LUFS readings:
- Integrated LUFS – The overall loudness of the entire song
- Short-Term LUFS – A rolling loudness average over a few seconds
- Momentary LUFS – Real-time, instant loudness
For most mastering music tasks, you’ll want to aim for:
- -14 LUFS Integrated for Spotify and YouTube
- -13 to -10 LUFS for more aggressive styles like EDM mastering
- -8 LUFS for club play or specific broadcast formats
These levels aren’t about being loud for the sake of it. They’re about being competitive, clear, and platform-ready.
How to Use LUFS Meters in Your Workflow
When you’re mastering a song, don’t rely on loudness by ear alone. Use LUFS meters throughout your process—especially after your compression and limiting stages. This ensures you don’t overdo it.
Here’s how:
- Before Limiting – Check your Short-Term LUFS to see how much headroom you have
- After Limiting – Monitor Integrated LUFS to lock in your final level
- Compare with References – Load up a reference track and match its loudness visually
Recommended Loudness Metering Tools
Here are some trusted tools that help with loudness-based mastering techniques:
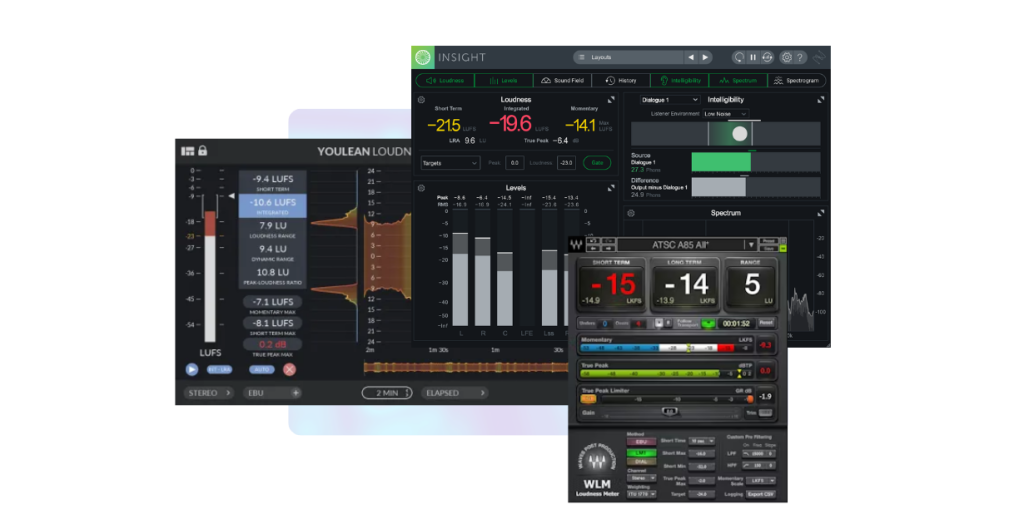
A) Youlean Loudness Meter
- One of the most popular free loudness meters
- Displays Integrated, Short-Term, and Momentary LUFS
- Visual history graph shows loudness consistency across your track
- Great for beginners and pros alike
B) iZotope Insight 2
- Full-featured metering suite
- Includes LUFS metering, spectrograms, and surround compatibility
- Ideal for users who want everything in one window
C) Waves WLM Plus
- Streamlined plugin with clear readouts
- Let’s you set target LUFS levels and alerts you when you go over
- Works well in fast-paced mastering sessions
Why LUFS Meters Should Be Your First Visual Check
Using a LUFS meter is one of the most reliable mastering techniques for loudness control. It takes the guesswork out of the process. Whether you’re mastering EDM, acoustic tracks, or podcasts, it helps you stay within platform limits and keep your audio sounding consistent.
By learning how to master a song using LUFS meters, you’re not just hitting numbers—you’re building trust. Your track will sound as good on a phone speaker as it does in a studio.
One of the most overlooked yet powerful mastering techniques is using a spectrum analyzer. While your ears give you the vibe of a song, spectrum analysers give you the truth. They show you exactly what’s happening in the frequency spectrum, from low-end sub-bass to high-end shimmer.
If you’re serious about mastering music, this tool becomes your best friend, especially when EQ balance is tricky.
Spectrum Analysers
One of the most overlooked yet powerful mastering techniques is using a spectrum analyser. While your ears give you the vibe of a song, spectrum analysers give you the truth. They show you exactly what’s happening in the frequency spectrum, from low-end sub-bass to high-end shimmer.
If you’re serious about mastering music, this tool becomes your best friend, especially when EQ balance is tricky.
Why Spectrum Analysers Matter in Mastering
When you’re trying to nail the EQ balance, your ears can sometimes misjudge frequencies, especially in untreated rooms. You might think the bass is booming when it’s really the mids causing the problem—or you might miss out on subtle harshness in the highs.
A spectrum analyser shows:
- Where your low-end peaks
- If your mids are too muddy
- Whether your highs are harsh or too soft
- If there are frequency gaps making your mix sound hollow
This type of insight helps you make smarter decisions when mastering a song—whether you’re boosting clarity, taming harshness, or filling in empty areas of the mix.
Real-Time vs Averaged Displays: What’s the Difference?
Most analysers offer real-time display and averaged curves. Here’s how to use them:
- Real-time mode: Good for catching peaks and transients as they happen
- Average mode: Better for spotting consistent problems like a buildup in the low-mids
Pro tip: Use both together. Real-time shows how your processing affects quick changes, while the average view reveals your track’s tonal shape over time.
Use Pink Noise as a Reference Curve
One of the smartest mastering techniques? Compare your spectrum to pink noise. Pink noise has a gentle downward slope and represents a flat, natural frequency balance. By matching your track’s spectrum to a pink noise curve (especially in the average view), you can achieve a more neutral and pleasing sound.
This trick is especially helpful when learning how to master a song without the best monitors or room acoustics.
Top Spectrum Analyzer Tools to Try
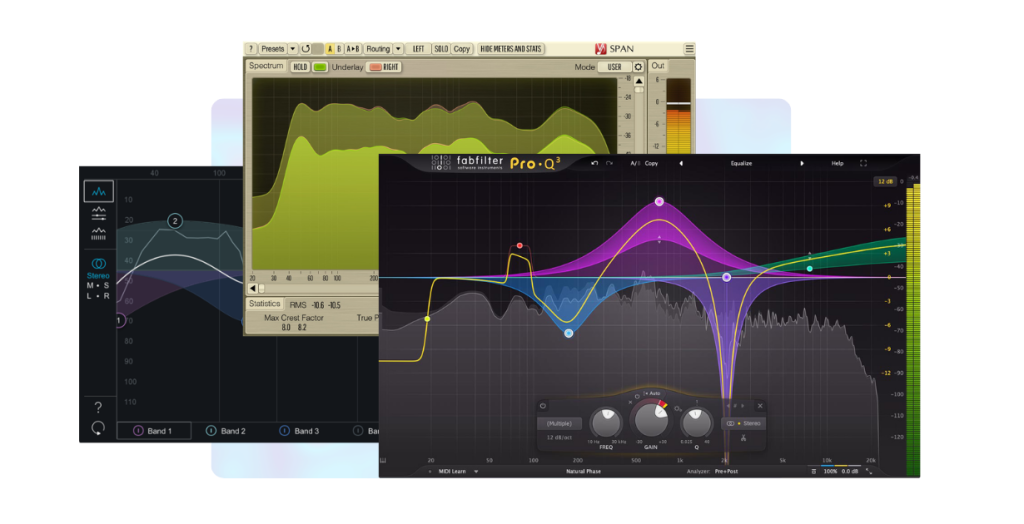
A) FabFilter Pro-Q 4
- Industry favourite for mastering music
- Has a built-in high-resolution spectrum analyser
- You can solo frequency bands, compare before/after curves, and even match EQ to a reference track
- The analyser adjusts dynamically based on where you’re zoomed in
B) SPAN by Voxengo (Free)
- A powerful and free option for real-time spectrum analysis
- Fully customizable visual layout
- Shows peak and RMS values simultaneously
- Great for tracking low-end and stereo balance
C) iZotope Ozone EQ and Spectral View
- Part of the Ozone mastering suite
- Offers clear visuals of frequency balance and stereo spread
- Let’s you see problems in EQ balance and fix them without guessing
- Integrates seamlessly into your digital mastering workflow
What to Watch for When Analysing a Master
Use spectrum analysers during EQ, compression, and final checks. Here’s what to look for:
- Low-End Buildup: Watch for spikes below 100 Hz—this can overwhelm your track.
- Muddy Mids: Excess energy between 200–500 Hz often causes mix “fog.”
- Harsh Highs: Peaks around 3–8 kHz can cause listener fatigue.
- Flatness: A completely flat curve isn’t always best. Focus on shape and musicality, not perfection.
Remember, you’re not chasing a “perfect line.” You’re using the analyser to understand your sound better and apply the right mastering techniques to serve the song.
Stereo Imaging Scopes
Stereo width can make or break a master. If a track feels too narrow, it can sound flat. If it’s too wide, it might run into phase issues that ruin how it sounds in mono. That’s why stereo imaging scopes are one of the most useful visual mastering techniques you can use.
They let you see how wide your track is, how your sounds are panned, and whether your mix is balanced between the left and right speakers.
Why Stereo Imaging Matters in Mastering
When you’re mastering music, you’re shaping the final impression of a song. That includes how big or immersive it feels. Stereo width adds space and depth to your sound.
Visual tools help you see:
- If your mix leans too far left or right
- If your vocals or bass are drifting from the center
- If the sides of your mix are causing phase cancellation
- How your mix behaves in mono vs stereo
These are details that are easy to miss by ear, especially in untreated rooms. But with visual scopes, you gain confidence and precision.
How Stereoscopes Work
Stereo scopes typically show a real-time display of your stereo field:
- A wide horizontal display means your track has lots of side content
- A vertical line usually means your mix is mono or very centered
- The more symmetrical the image, the more balanced your stereo field is
This helps you see where your instruments sit and whether you’re achieving a clean, professional stereo image.
Tips for Visual Stereo Imaging
Here are some practical mastering techniques to get the best stereo width:
- Keep the Low End Centered – Frequencies below 150 Hz should stay mono. This helps your kick and bass hit harder and sound tight.
- Widen High Frequencies Only – Use stereo widening tools to expand cymbals, pads, and textures above 3–4 kHz. This adds space without causing phase problems.
- Watch for Over-Widening – If your scope shows content pushing far beyond the center line or flipping direction, check for phase issues. Always monitor your mix in mono to catch problems early.
- Mid/Side EQ Adjustments – Some EQ plugins allow Mid/Side mode. Boosting the sides in the highs while keeping mids centered is a subtle way to add width without hurting clarity.
Recommended Stereo Imaging Tools
You can use several stereo imaging tools that can provide you with accurate readings. Here is the list, including free and paid tools.
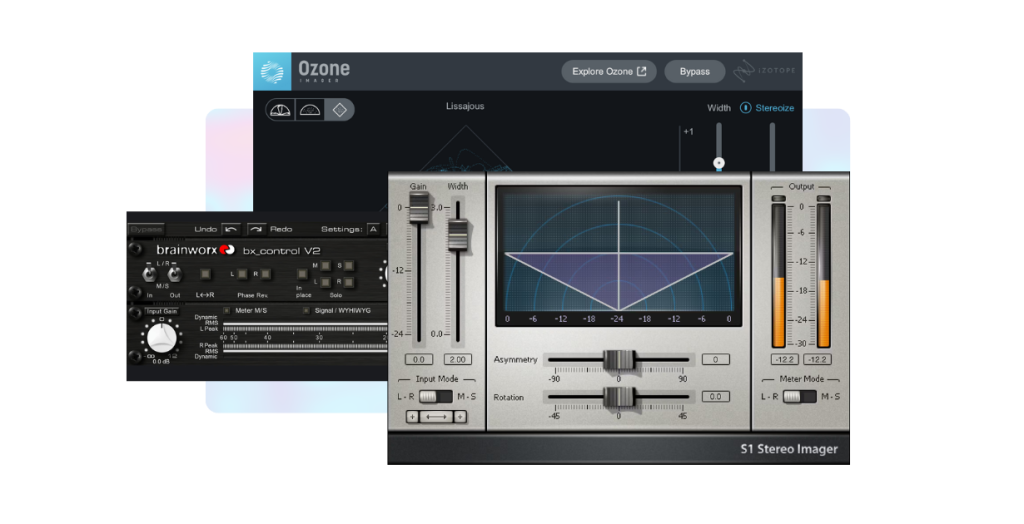
A) iZotope Ozone Imager – Free Tool
Ozone Imager can be used as a standalone plugin or can also be integrated within Ozone 9.
- It offers an easy-to-read stereo field visualizer
- Great for spotting width imbalances
- “Stereoize” mode helps in making your sound spread across the spectrum without causing phase issues
B) Waves S1 Stereo Imager
- Gives you control over width and balance
- Includes rotation and asymmetry features
- Excellent for reshaping the stereo image during digital mastering
C) Brainworx bx_control V2
- Offers detailed Mid/Side metering
- Let’s you solo mid or side channels
- Great for spotting issues and refining stereo content in EDM mastering and other layered genres.
Phase correlation Meters
You’ve got the EQ right. The stereo width sounds nice and wide. But then… You switch your master to mono—and suddenly, things sound hollow or parts vanish. What happened? That’s a phase issue, and it’s one of the most frustrating problems in mastering music.
The good news? You can spot and fix phase issues before they ruin your track. All you need is a phase correlation meter—a powerful visual tool that helps you check stereo compatibility.
What is Phase correlation?
Phase correlation tells you how well the left and right sides of your mix work together. It’s especially important in stereo imaging. When your left and right signals are out of sync, it causes parts of your mix to cancel out when played in mono.
This is common when using wide stereo effects, reverb, or duplicated instruments panned differently. In some cases, your track might sound great in stereo but become weak or even broken in mono.
That’s why phase correlation meters are a must-have tool in your set of mastering techniques.
How to Read a Phase Meter?
Most phase correlation meters show a scale from +1 to -1:
- +1 = Perfect mono (both sides are identical)
- 0 = Wide stereo, but still in phase
- -1 = Complete phase cancellation (your mix is in trouble!)
As a rule of thumb:
- Stay between +1.0 and +0.3 for a strong stereo image
- If your meter dips below 0, start checking what’s going on with your stereo widening or effects
How to Use Phase Meters when Mastering a Song
Here are some reliable audio processing practices:
- Check During Stereo Widening – If you’re adding width using plugins, always watch the phase meter. If it leans toward -1, dial things back.
- Flip to Mono Regularly – Use your DAW’s mono switch or a utility plugin to check how your track sounds in mono. If anything disappears, you’ve likely got phase problems.
- Use Mid/Side EQ for Better Control – Instead of adding wide reverb or doubling tracks, use mid/side EQ. This helps you shape the stereo field without risking phase cancellation.
Recommended Phase Monitoring Tools
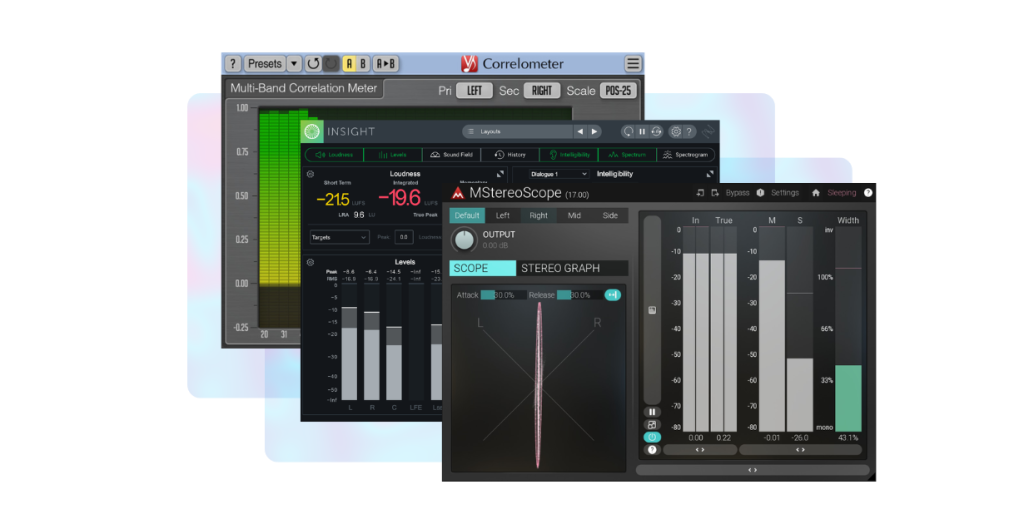
A) Voxengo Correlometer (Free)
- A reliable, easy-to-read correlation meter
- Shows multiple frequency bands and their correlation
- Perfect for catching frequency-specific phase issues
B) iZotope Insight 2
- Includes a professional-grade phase meter
- Integrated into a full metering suite
- Great for deep analysis during digital mastering
C) MeldaProduction MStereoScope
- Visual stereo field and correlation meter in one
- Helps you fine-tune EDM mastering, where stereo depth is key
- Let’s you isolate mid and side signals for cleaner adjustments
Why Phase Meters Are Essential in Mastering Techniques
Phase problems can be hard to hear but easy to see. That’s the real power of using visual tools while mastering a song. With a quick glance at your phase meter, you can spot potential mono issues and fix them before they cost you streaming quality or even radio play.
Good mastering isn’t just about sounding great in headphones. It’s about sounding great everywhere—from club speakers to car radios. Phase meters make that possible.
Dynamic Range and Gain Reduction in Mastering Techniques
Compression is one of the most powerful mastering techniques but it can also be the trickiest. A little too much, and you kill the punch. Too little, and your track feels loose or unpolished. That’s where dynamic range meters and gain reduction displays come in handy.
These visual tools help you control how much compression you apply during mastering, and whether you’re preserving the natural feel of your track.
What is Dynamic Range?
Dynamic range calculates difference between the softest and loudest sounds in audio. In music mastering, it’s all about finding that sweet spot, where your track feels energetic and tight, but still breathes.
A healthy dynamic range:
- Keeps drums punchy
- Preserves vocal emotion
- Prevents your track from sounding flat or “squashed”
The best masters maintain dynamics while still being loud enough for streaming. Visual tools let you measure and control that balance.
What is Gain Reduction and Why Does it Matter?
Gain reduction tells you how much the compressor is reducing the signal’s volume. When the gain reduction meter shows 3 dB, it means the compressor is pulling down the signal by that amount.
Here’s why these matters:
- Too much reduction = over-compression = lifeless track
- Too little reduction = under-compression = weak or unglued mix
Watching the meter helps you keep compression subtle and effective.
Key Metrics to Watch in Visual Compression
1. Peak and RMS
- Peak shows the highest point of your signal
- RMS gives an average loudness over time
- Use both to ensure your track is loud and smooth
2. Crest Factor
- The difference between Peak and RMS
- A high crest factor = more dynamics
- A low crest factor = more compression. A good crest factor (around 8–12 dB) keeps your music punchy
3. Gain Reduction Meter
- Watch for gentle movements, not huge dips
- Ideal for digital mastering and styles like EDM Mastering, where control matters
Recommended Tools for Visual Compression
A) iZotope Ozone Imager (Free)
- Offers an easy-to-read stereo field visualizer
- Great for spotting width imbalances
- Includes a stereo widening tool with a “Stereoize” mode that avoids phase problems
B) Waves S1 Stereo Imager
- Gives you control over width and balance
- Includes rotation and asymmetry features
- Excellent for reshaping the stereo image during digital mastering
C) Brainworx bx_control V2
- Offers detailed Mid/Side metering
- Let’s you solo mid or side channels
- Great for spotting issues and refining stereo content in EDM mastering and other layered genres.
Visual Workflow Walkthrough
Now that you’ve learned how visual tools work, let’s put them into action. In this section, we’ll walk through a simple mastering workflow—step by step—using your meters as guides.
Whether you’re just learning how to master a song or you’re already deep into mastering music regularly, this process will help you stay in control and get better, faster results.
Step 1: Start with Loudness
Begin with the Youlean Loudness Meter or a similar LUFS tool.
- Aim for -14 LUFS Integrated for streaming platforms like Spotify
- Go lower (around -6 to -10 LUFS) for EDM mastering or club play
- Use Short-Term LUFS to see if any part of your track is too loud
Why it matters: This step sets your loudness ceiling. Without it, you might over-compress or under-deliver.
Tools: Youlean Loudness Meter, iZotope Insight 2, Waves WLM Plus
Step 2: Check Frequency Balance with a Spectrum Analyzer
Open up FabFilter Pro-Q 3 or SPAN.
- Play your track from start to finish
- Look for peaks or dips in the low end, mids, or highs
- Use a pink noise curve as a reference for EQ balance
Make small EQ adjustments to correct any major imbalances. Your spectrum analyser will tell you if your audio processing is helping or hurting.
Tools: FabFilter Pro-Q 3, SPAN, iZotope Ozone EQ
Step 3: Analyze and Adjust Stereo Imaging
Now it’s time to visualize your stereo width.
- Launch iZotope Ozone Imager
- Watch how your mix spreads across the stereo field
- Widen only the high frequencies—keep your bass and kick in the center
- Check for symmetry in your stereoscope
Tip: Don’t overdo widening. If the stereo image looks too extreme, your track might collapse into mono.
Tools: Ozone Imager, Waves S1 Stereo Imager, Brainworx bx_control V2
Step 4: Watch Your Phase
Flip over to your phase correlation meter.
- Look for consistent readings above +0.3
- If the needle drops toward 0 or below, check your reverb, delays, or stereo effects
- Always A/B test your master in mono
If your stereo tricks are causing phase problems, now’s the time to fix them.
Tools: Voxengo Correlometer, Insight Phase Meter
Step 5: Use Gain Reduction and Dynamic Range Meters
Apply light compression (1–2 dB of gain reduction).
- Use a compressor like FabFilter Pro-C 2
- Watch the gain reduction meter to avoid squashing your track
- Compare RMS and Peak levels to preserve dynamics
- Target a Crest Factor of around 8–12 dB
Why it matters: This ensures your master still has life and punch while staying smooth and professional.
Tools: Pro-C 2, Waves MV2, Insight 2 Dynamics Tab
Step 6: Final Limiting and Loudness Check
Bring up your limiter and loudness meter.
- Apply limiting gradually until you hit your final LUFS target
- Make sure your true peak doesn’t go above -1 dBTP
- Compare with a reference track—visually and by ear
Recheck your loudness curve using the Youlean Loudness Meter to ensure smooth playback across platforms.
Tools: FabFilter Pro-L 2, Oxford Inflator, Youlean Loudness Meter
Step 7: Final A/B Testing and Visual Review
Before you bounce your master:
- Do a side-by-side comparison with your unmastered mix
- Watch how your spectrum, stereo image, and loudness have changed
- Listen in headphones, monitors, and even phone speakers
- Re-check all your meters for any red flags
This is where your eyes help your ears make the final call.
Final thoughts
In this blog, we explored how visual mastering techniques help you gain deeper control over loudness, EQ balance, stereo imaging, dynamics, and phase alignment. From LUFS meters to spectrum analysers and gain reduction meters, each tool gives you a new layer of insight that your ears alone might miss.
Using these visual cues allows music producers, whether beginners or pros, to make smarter, faster, and more confident decisions during the mastering process. And if you ever feel overwhelmed by all these steps, platforms like Remasterify can help. It brings together many of these visual and technical insights in a simplified, AI-powered workflow that helps you master your track in seconds, without losing its essence.
So whether you’re DIY mastering or using smart tools, the goal stays the same: a clean, loud, and professional-sounding final master.